CJ, the EJ Guy

GIS and Data Science Consultant,
First-Generation Graduate
Coding Portfolio
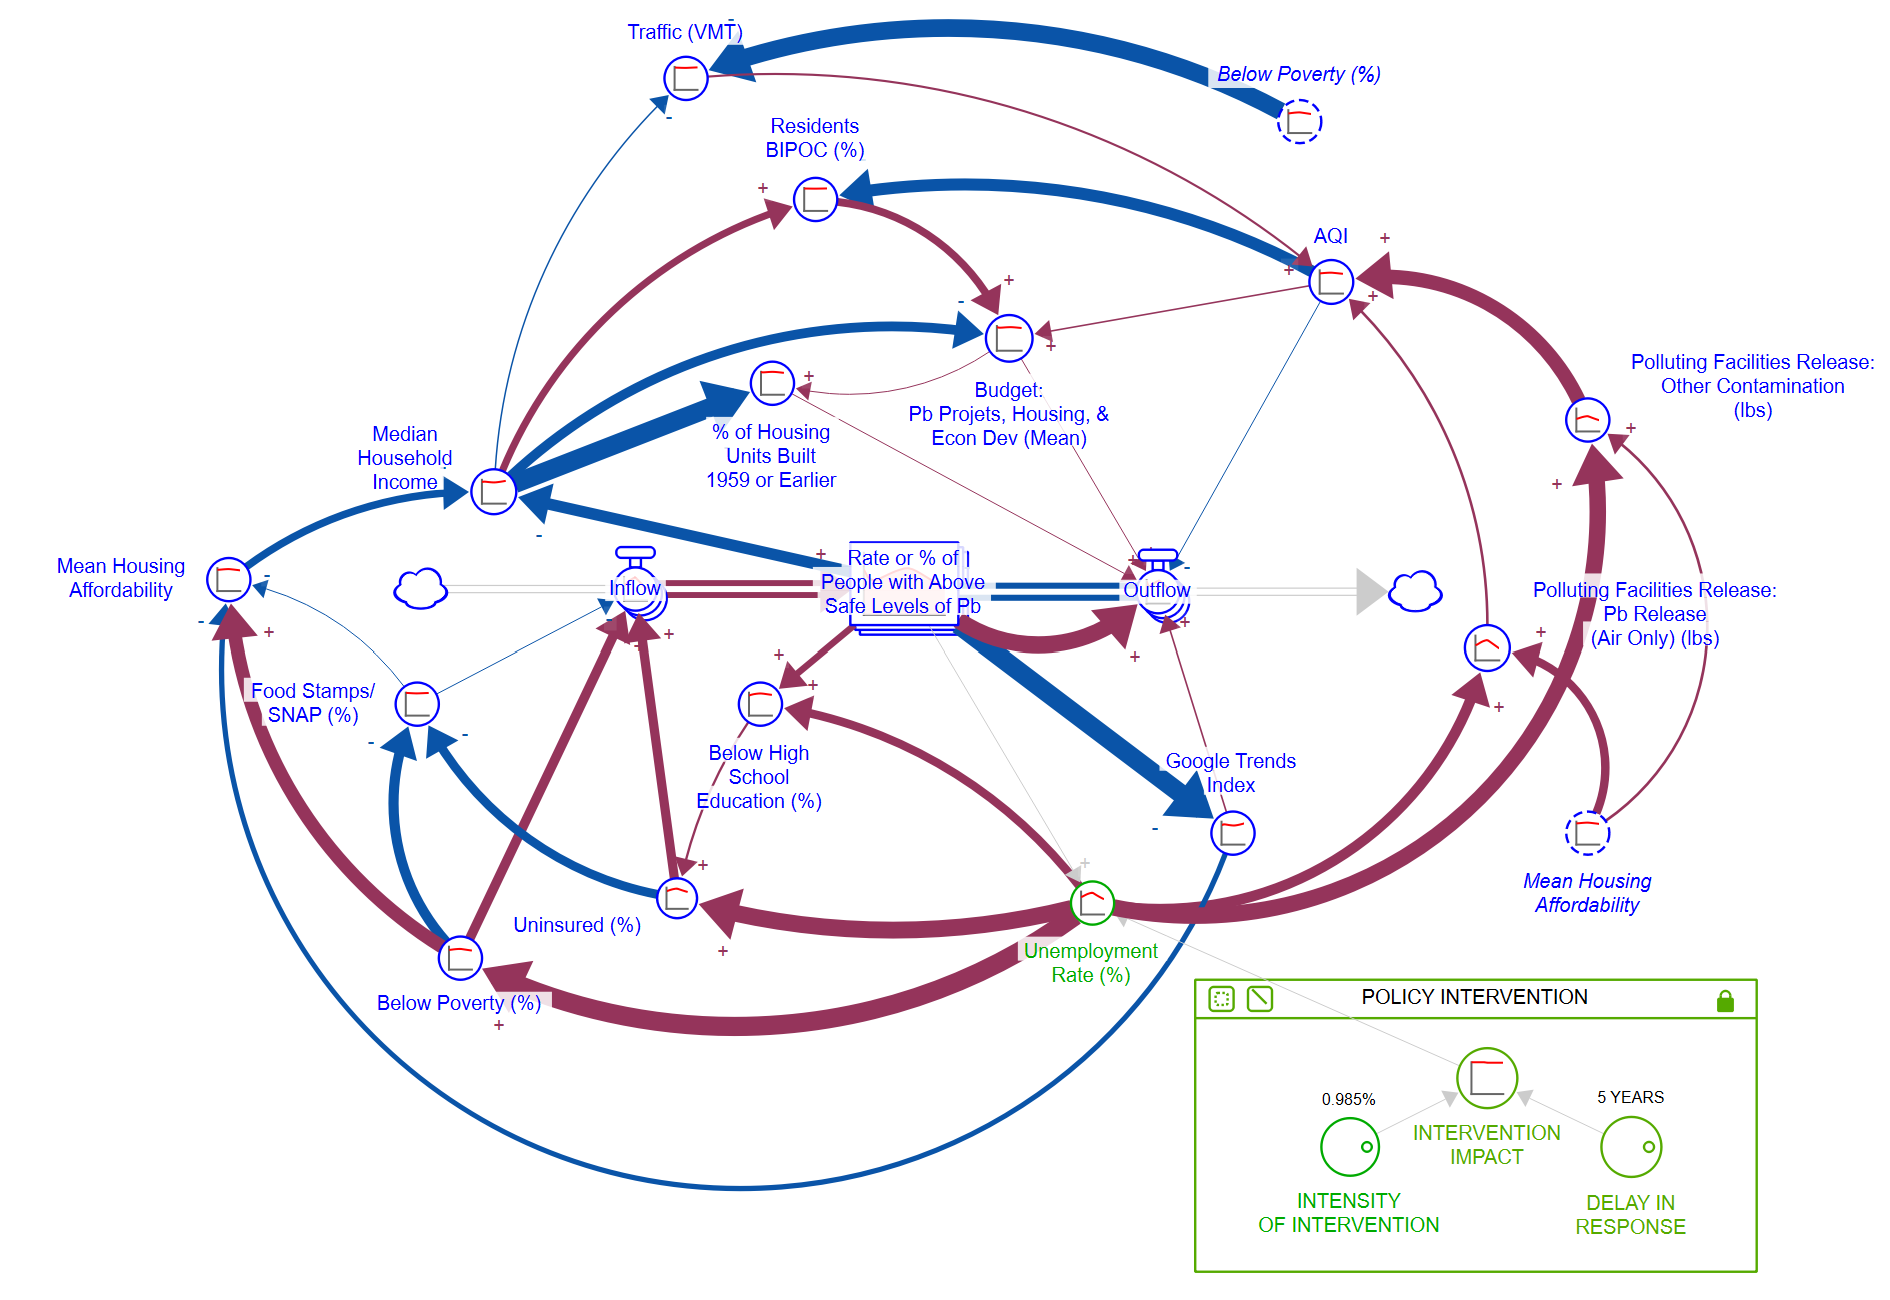
Simluation of Policy Impacts on Community Pb Exposure (Dissertation Project)
- Description: This project created a simulative ‘laboratory’ of Newark, New Jersey, allowing the user to test the impact of policy interventions on Pb exposure and equity. This model was created using a natural-intelligence guided covariation mining approach, characterizing the interactions between community social, economic, environmental, and big data factors through regression fitting. Manuscript currently in review, model specifics available upon request.
- Tools: R, iSee Systems Stella Architect
- Key Packages: GreyModel, dplyr, stats, sf, gtrendsR
- Link: Relevant Scripts

ESGrader - Building an ESG Assessment Tool for Renewable Energy Projects (Hackathon Project)
- Description: This project is the culmination of a 2-day in-person Hackathon called “AI Agents for Faster Renewable Energy Projects”, taking place in New York City. Our team of four focused on building a tool for processing Environmental, Social, and Governance (ESG) surveys, calculating ESG and Impact scores, and providing context-specific recommendations for improvement. The final product resulted in custom Python packages, a front-end wireframe, and runway for future ML development.
- Language: Python
- Key Packages: geopandas, pandas, numpy
- Link: Custom Python Modules
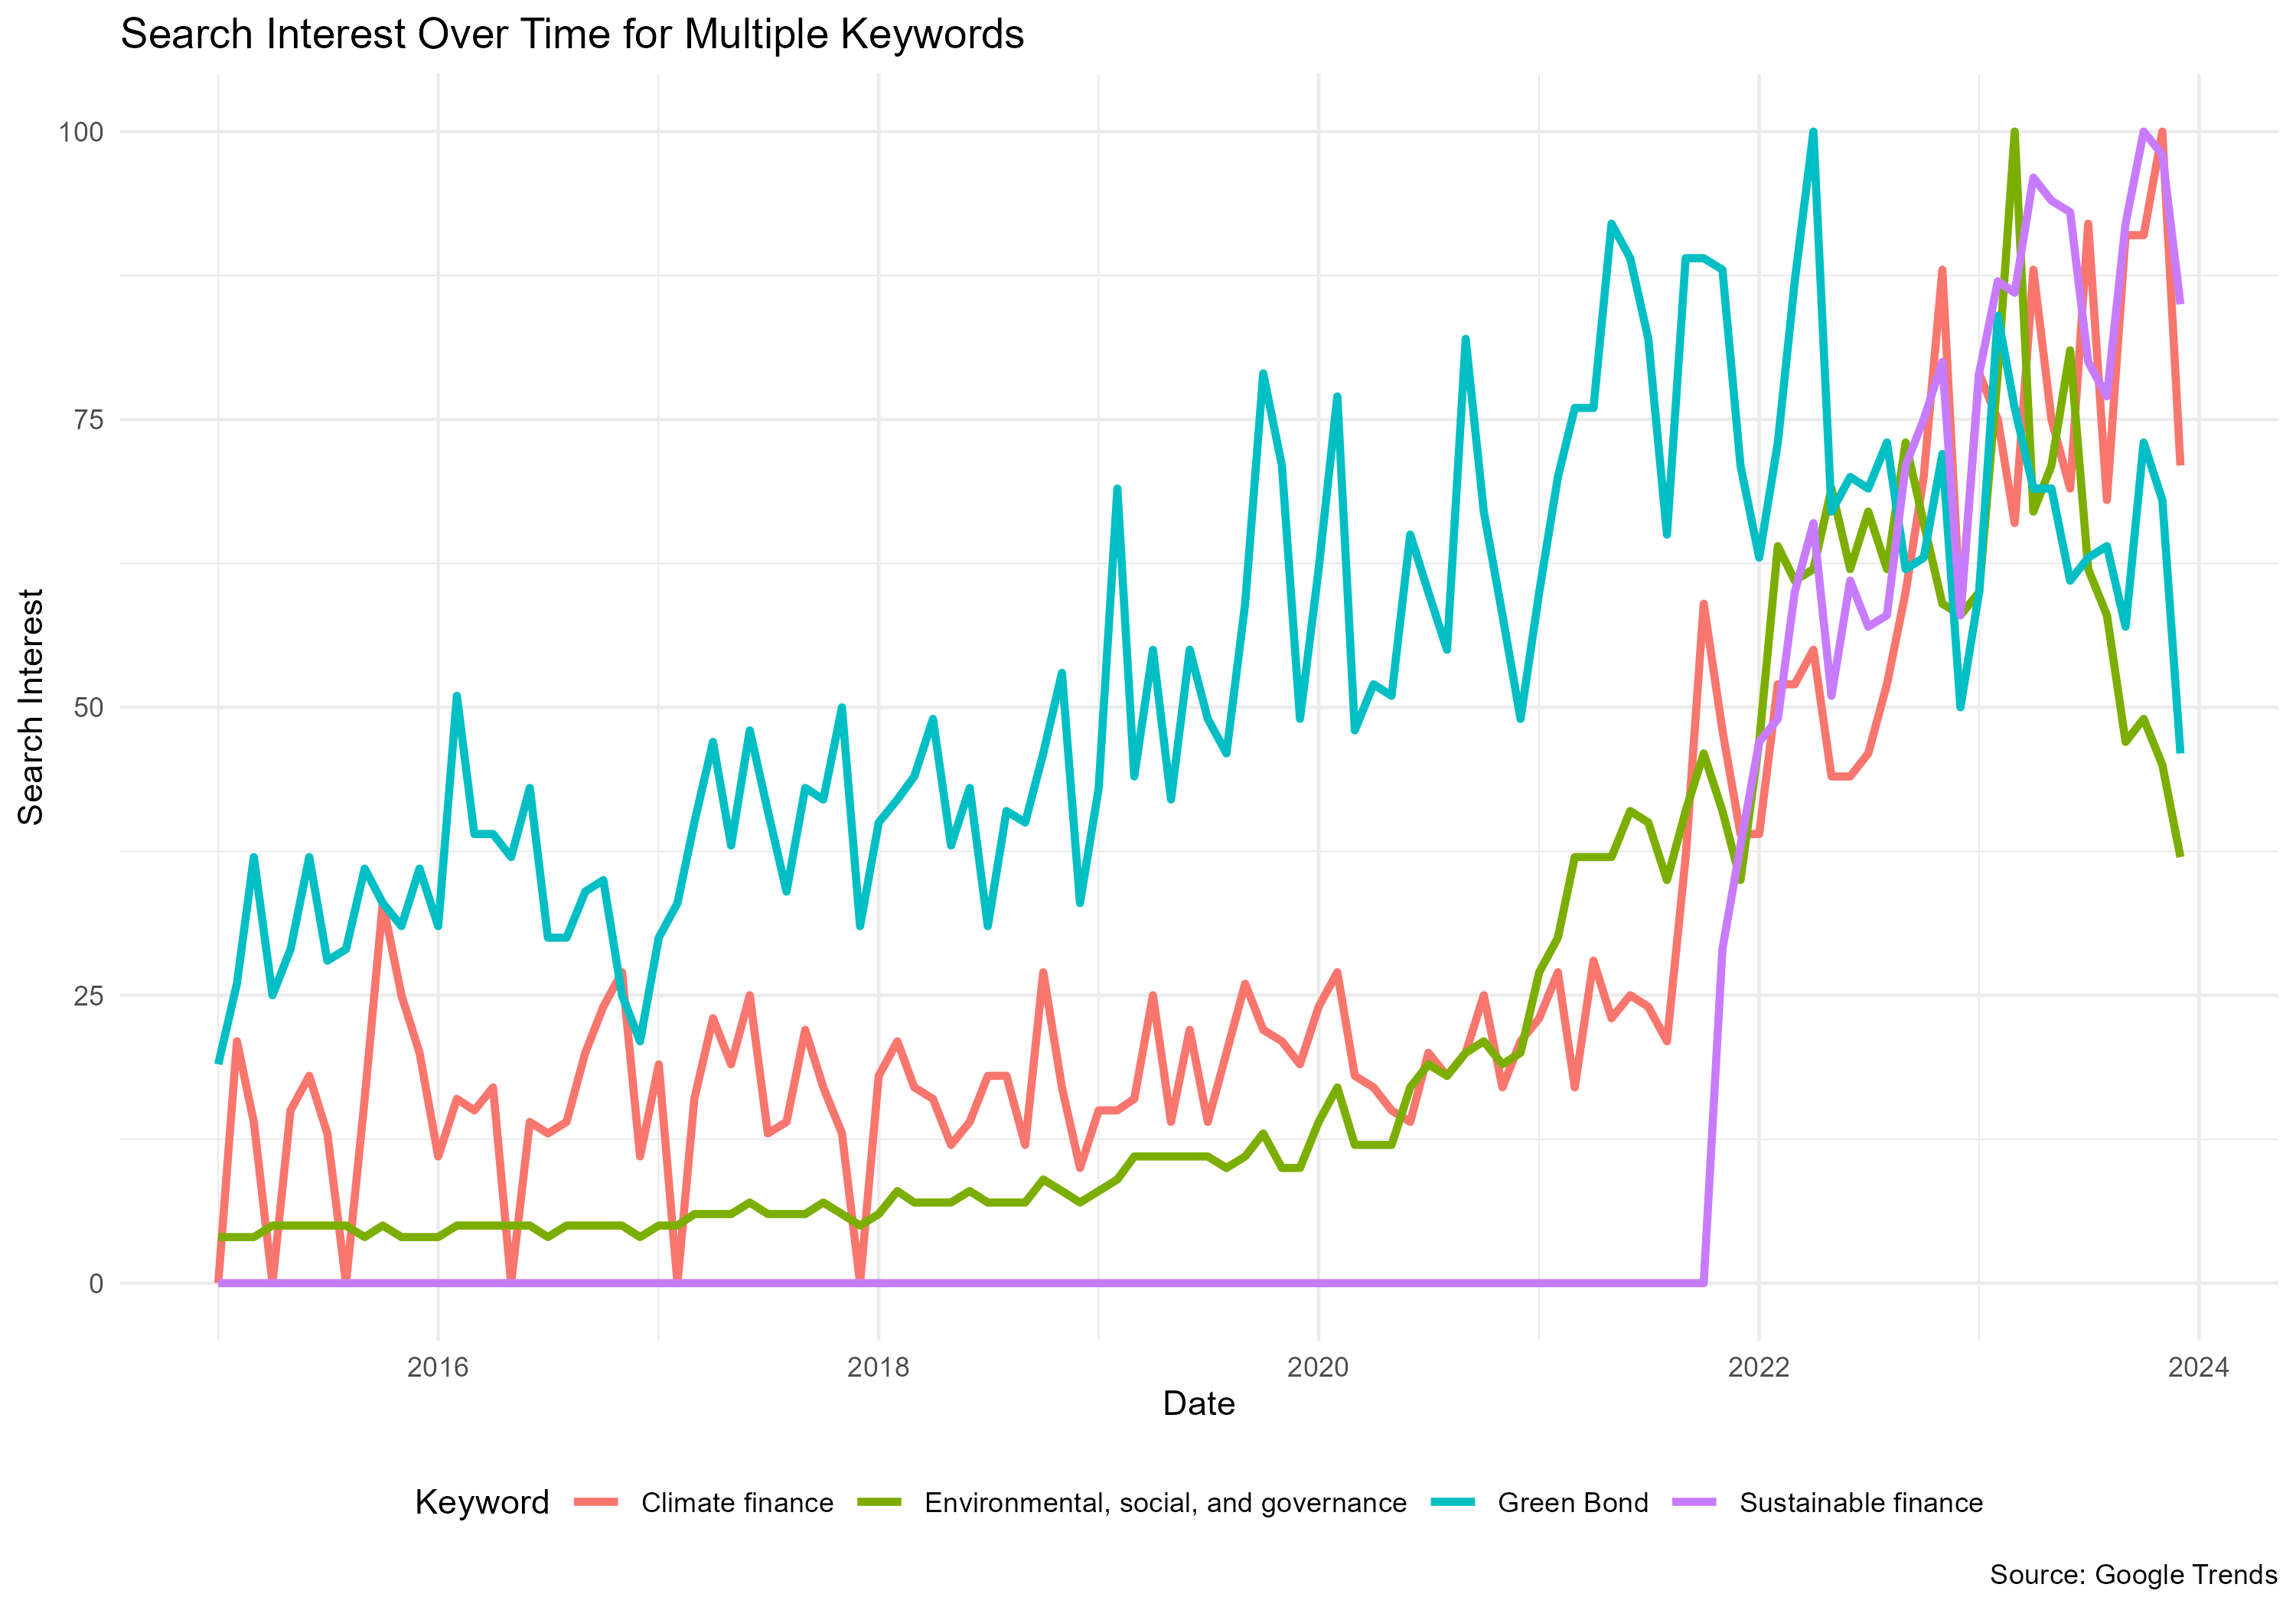
Assessing Green Finance Interest and Information Accessibility
- Description: This is project aimed to identify the popularity and accessibility of information around green finance. This script generates search frequency for topics such as green bonds and ESG and plots the data temporally and geographically.
- Language: R
- Key Packages: gtrendsR, tidycensus, tidyr, ggplot2, dplyr
- Link: R Project
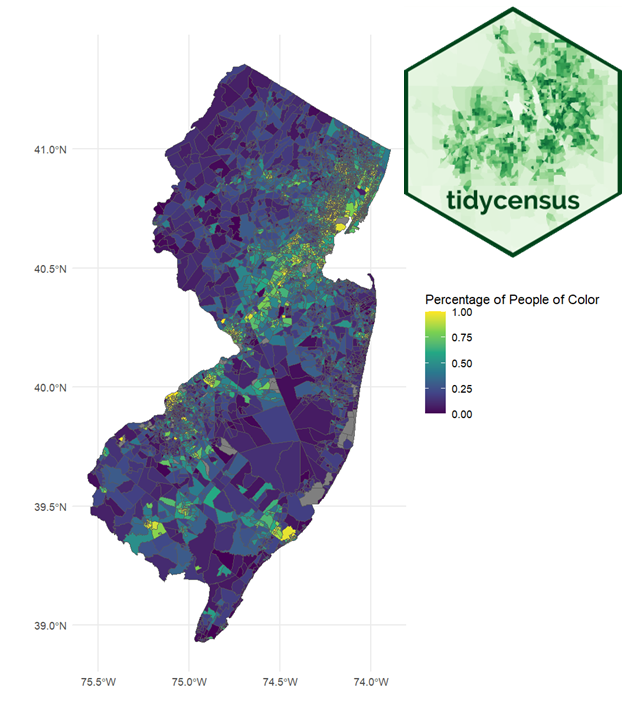
Accessing the Census API Using R: Geospatial Equity Analysis and Visualizations
- Description: This project aimed to analyze the relationship between socioeconomic characteristics and brownfields in New Jersey. This script generates geographically enriched census data directly from the US Census API, conducts a buffer-intersection and inverse-distance weighting analysis, and plots the results. The final dataset is being used to study brownfield distributions from an environmental justice perspective.
- Language: R
- Key Packages: tidycensus, ggplot2, dplyr, sf, spdep
- Link: R Project

Big Data, Big Macs, Big Injustices? Analyzing Big Data Collection, Public Health, and Food Justice
- Description: This is a project aiming to discern the relationship between big data and food justice in California using a data justice framework. This script draws temporal interest in fast food mobile applications over time and across regions from the Google Trends tool. The resulting data is compared with demographic and health datasets to extrapolate relationships between targeted advertising, corporate data collection, and public health risks. A spatial panel regression approach is utilized to control for spatial and temporal autocorrelation.
- Language: R
- Key Packages: gtrendsR, splm, spdep, dplyr
- Link: R Project
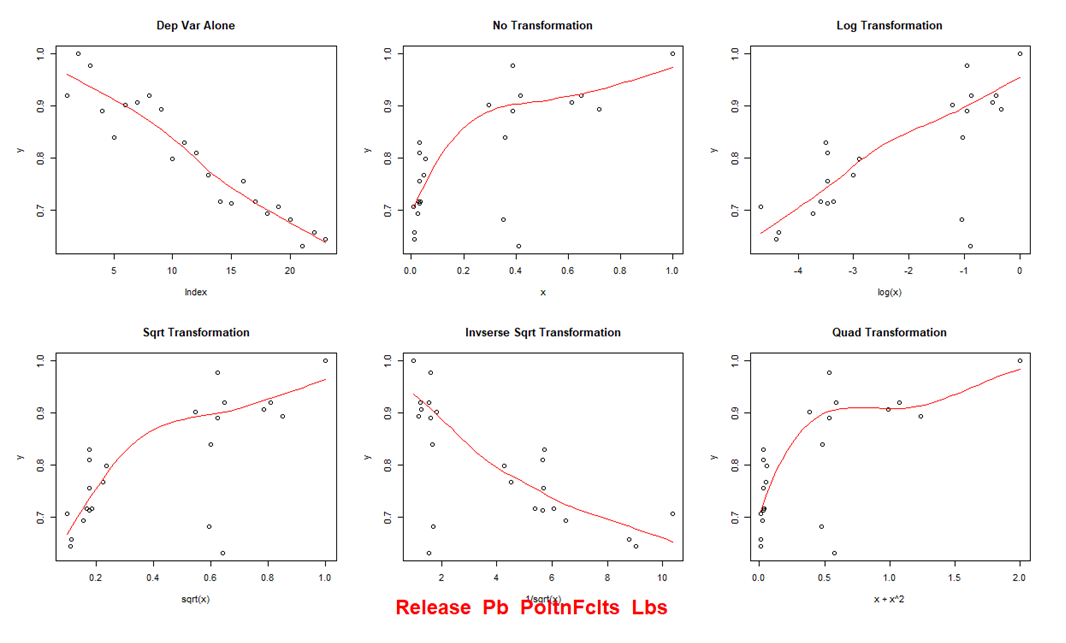
High-Level Covariation Mining for Simulative Tools
- Description: This code was utilized to generate relationships within a system dynamics model. The script performs data analysis by fitting multivariate linear regression and grey models with various transformations. It includes functions for generating grey model parameters, plotting scatter plots with different transformations, calculating and recording R-squared values from linear models, and generating and storing regression outputs, all while handling data preprocessing and visualization.
- Language: R
- Key Packages: stats, GreyModel
- Link: R Script File

Mining Google Search and Google Trends Data for Environmental Interest
- Description: This code performs web scraping to collect Google search result counts and Google Trends data for specified keywords over a selected timeframe. Using the RSelenium package, it navigates to Google search pages for each keyword and extracts the total number of search results for each month. Additionally, it fetches historical Google Trends data for the same keywords using the gtrendsR package, compiling the data into dataframes that are then exported as CSV files for further analysis.
- Language: R
- Key Packages: RSelenium, gtrendsR
- Link: R Script File

Collecting, Cleaning, and Analyzing Tweets
- Description: This code retrieves and processes geolocated tweets in New Jersey using the Twitter API. It first sets up API tokens and constructs a query to fetch relevant tweets, which are then saved as JSON files. The script subsequently imports these JSON files, cleans and processes the tweet text by removing unnecessary characters and stopwords, and performs text analysis to tokenize and count word occurrences. Finally, it filters and summarizes the word counts, exporting the cleaned and analyzed data to a CSV file.
- Language: R
- Key Packages: rtweet, academictwitteR, dplyr, jsonlite
- Link: R Script File

Scraping Environmental Justice Publication Abstracts for Most Popular Words
- Description: This code scrapes and processes PDFs of environmental justice research publications to analyze abstract word frequencies. It reads PDF files in the current directory, converts their text into a corpus, and cleans the text. The code identifies and extracts terms that appear frequently across the documents, calculates their total occurrences, and writes the sorted word counts to a CSV file for further analysis.
- Language: R
- Key Packages: pdftools, tm, rvest
- Link: R Script File

Statistical Analyses of Environmental Justice “Awareness” and Traditional Measures
- Description: This code conducts an analysis of environmental justice awareness based on tweet counts within census tracts. It imports shapefiles containing tweet data and calculates a normalized environmental justice awareness metric. The code then explores the linear relationships between this awareness metric and various demographic and environmental variables through scatter plots and linear models. Additionally, it checks for spatial autocorrelation and fits spatial error models to account for potential spatial dependencies in the data.
- Language: R
- Key Packages: sf, spdep
- Link: R Script File

Automating Spatial Joins in GIS using ArcPy
- Description: This Python script uses the ArcPy library to process point data by importing tables, adding spatial attributes, and performing spatial joins to assign zone information. It then exports the processed data and converts them to text files for further analysis.
- Language: Python
- Key Packages: arcpy, dbf
- Link: Python Script as Text File